US Carbon Markets Ride the Blue Wave, EU-UK Summit on November 20 in Focus
By Mark Lewis & Climate Finance Partners LLC (CLIFI)
6 Min. Read Time
The US mid-term results produced a so-called blue wave, with the Democrats taking both chambers of Congress and US carbon markets responding positively, with California carbon allowances (CCAs) up 1.5% last week, Regional Greenhouse Gas Initiative allowances (RGAs) 4%, and Washington state allowances (WCAs) 8%. California and six of the eleven RGGI states also held gubernatorial elections, with the Democrats easily retaining California, and all six RGGI states maintaining the same party affiliation in the Governor’s mansion (four Democrats, two Republicans). Meanwhile, California’s 2025 verified emissions came in very much in line with our expectations.
In Europe, EUAs retreated from their recent highs at the end of last week, as natural-gas prices dropped sharply, with the focus now on the forthcoming EU-UK summit on November 20. Media reports last week provided a sneak peak of a leaked draft communiqué on linking the UK-ETS with the EU-ETS to be announced at the summit, and the UKA discount to EUAs is now trading near the lows for the year on optimism that full operationalization of the link will happen by 2028.
Democratic success in US mid-terms lifts US carbon markets
The US mid-terms last week saw both the House of Representatives and the US Senate flip from Republican to Democratic control, with the Democrats’ margin of victory greater than expected in both cases.
In the House, NBC currently has the Democrats on 254 seats to the Republicans’ 163 (a net gain of 43 seats,) with 18 seats yet to be called, and NBC projects that the final tally will be 259 Democrats to 176 Republicans. In the Senate, the Democrats have so far flipped seven seats to stand at 54 to the Republicans’ 44, with the Democrats also marginally ahead in the two races not yet called (Alaska and Mississippi).
In the 36 gubernatorial races last week, the Democrats flipped five states and are ahead in the two races still outstanding (Alaska and Kansas), so will likely end up with 30 states to the Republicans’ 20.Xavier Becerra comfortably secured the California governorship for Democrats, while in the six RGGI states holding gubernatorial races, four stuck with their Democratic affiliation (Connecticut, Massachusetts, Maryland, and Rhode Island), and two remained in Republican hands (New Hampshire and Vermont).
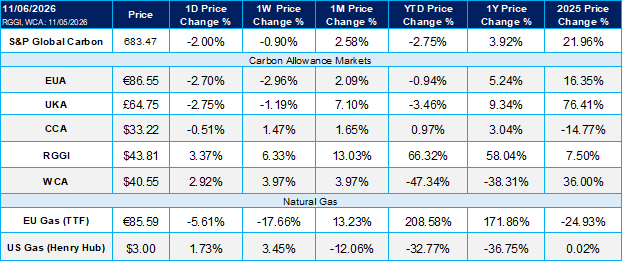
US carbon markets reacted positively to the results. Dec-26 CCAs settled at $33.2/t on Friday, November 6, up 1.5% on the previous week’s close, while Dec-26 RGAs settled at $43.7/short ton (up 4.1%), and Dec-26 WCAs at $42.3/t (up 8%). While the House and Senate results have no direct impact on the three US state and regional carbon markets, they provide a positive sentiment tailwind given (i) Democrats’ historically stronger support for climate action and (ii) the potential for continued federal challenges under President Trump.
At the gubernatorial level, attention will now focus on the intentions of incoming California governor, Xavier Becerra. We do not expect Becerra to make any changes to the cap-and-invest program and do not think he will interfere with the planned time-line for Washington to join the WCI program in 2027, as nothing he has said or done so far would suggest he intends to put up roadblocks. We do think it likely, however, that he will look to replace the current chair of CARB (CA cap-and-invest regulator), Lauren Sanchez, when her current term ends on December 31.
California’s 2025 verified emissions in line with our estimates
Beyond the political changes last week, California published its verified emissions data (VED) for 2025. Verified emissions came in at 247.5m tCO2e, down 3.9% on 2024. Emissions from in-state power production saw the largest drop in 2025, with in-state natural-gas generation down 15% year-over-year (YoY) as a result of increased renewable-energy production. Refining-sector emissions fell 7% in 2025 as the Phillips-66 Wilmington refinery wound down during the year. The industrial sectors also reported a decline in emissions, in line with the decrease in industrial natural-gas use throughout the year.
Overall, California’s VED were in line with our estimates, and adding California’s 247.5Mt to Quebec’s 2025 VED of 57.2Mt, we derive total WCI emissions for 2025 of 305Mt, very slightly below our own estimate of 307Mt.
Our updated RGGI balances beyond 2030 suggest (much) more supply will be needed
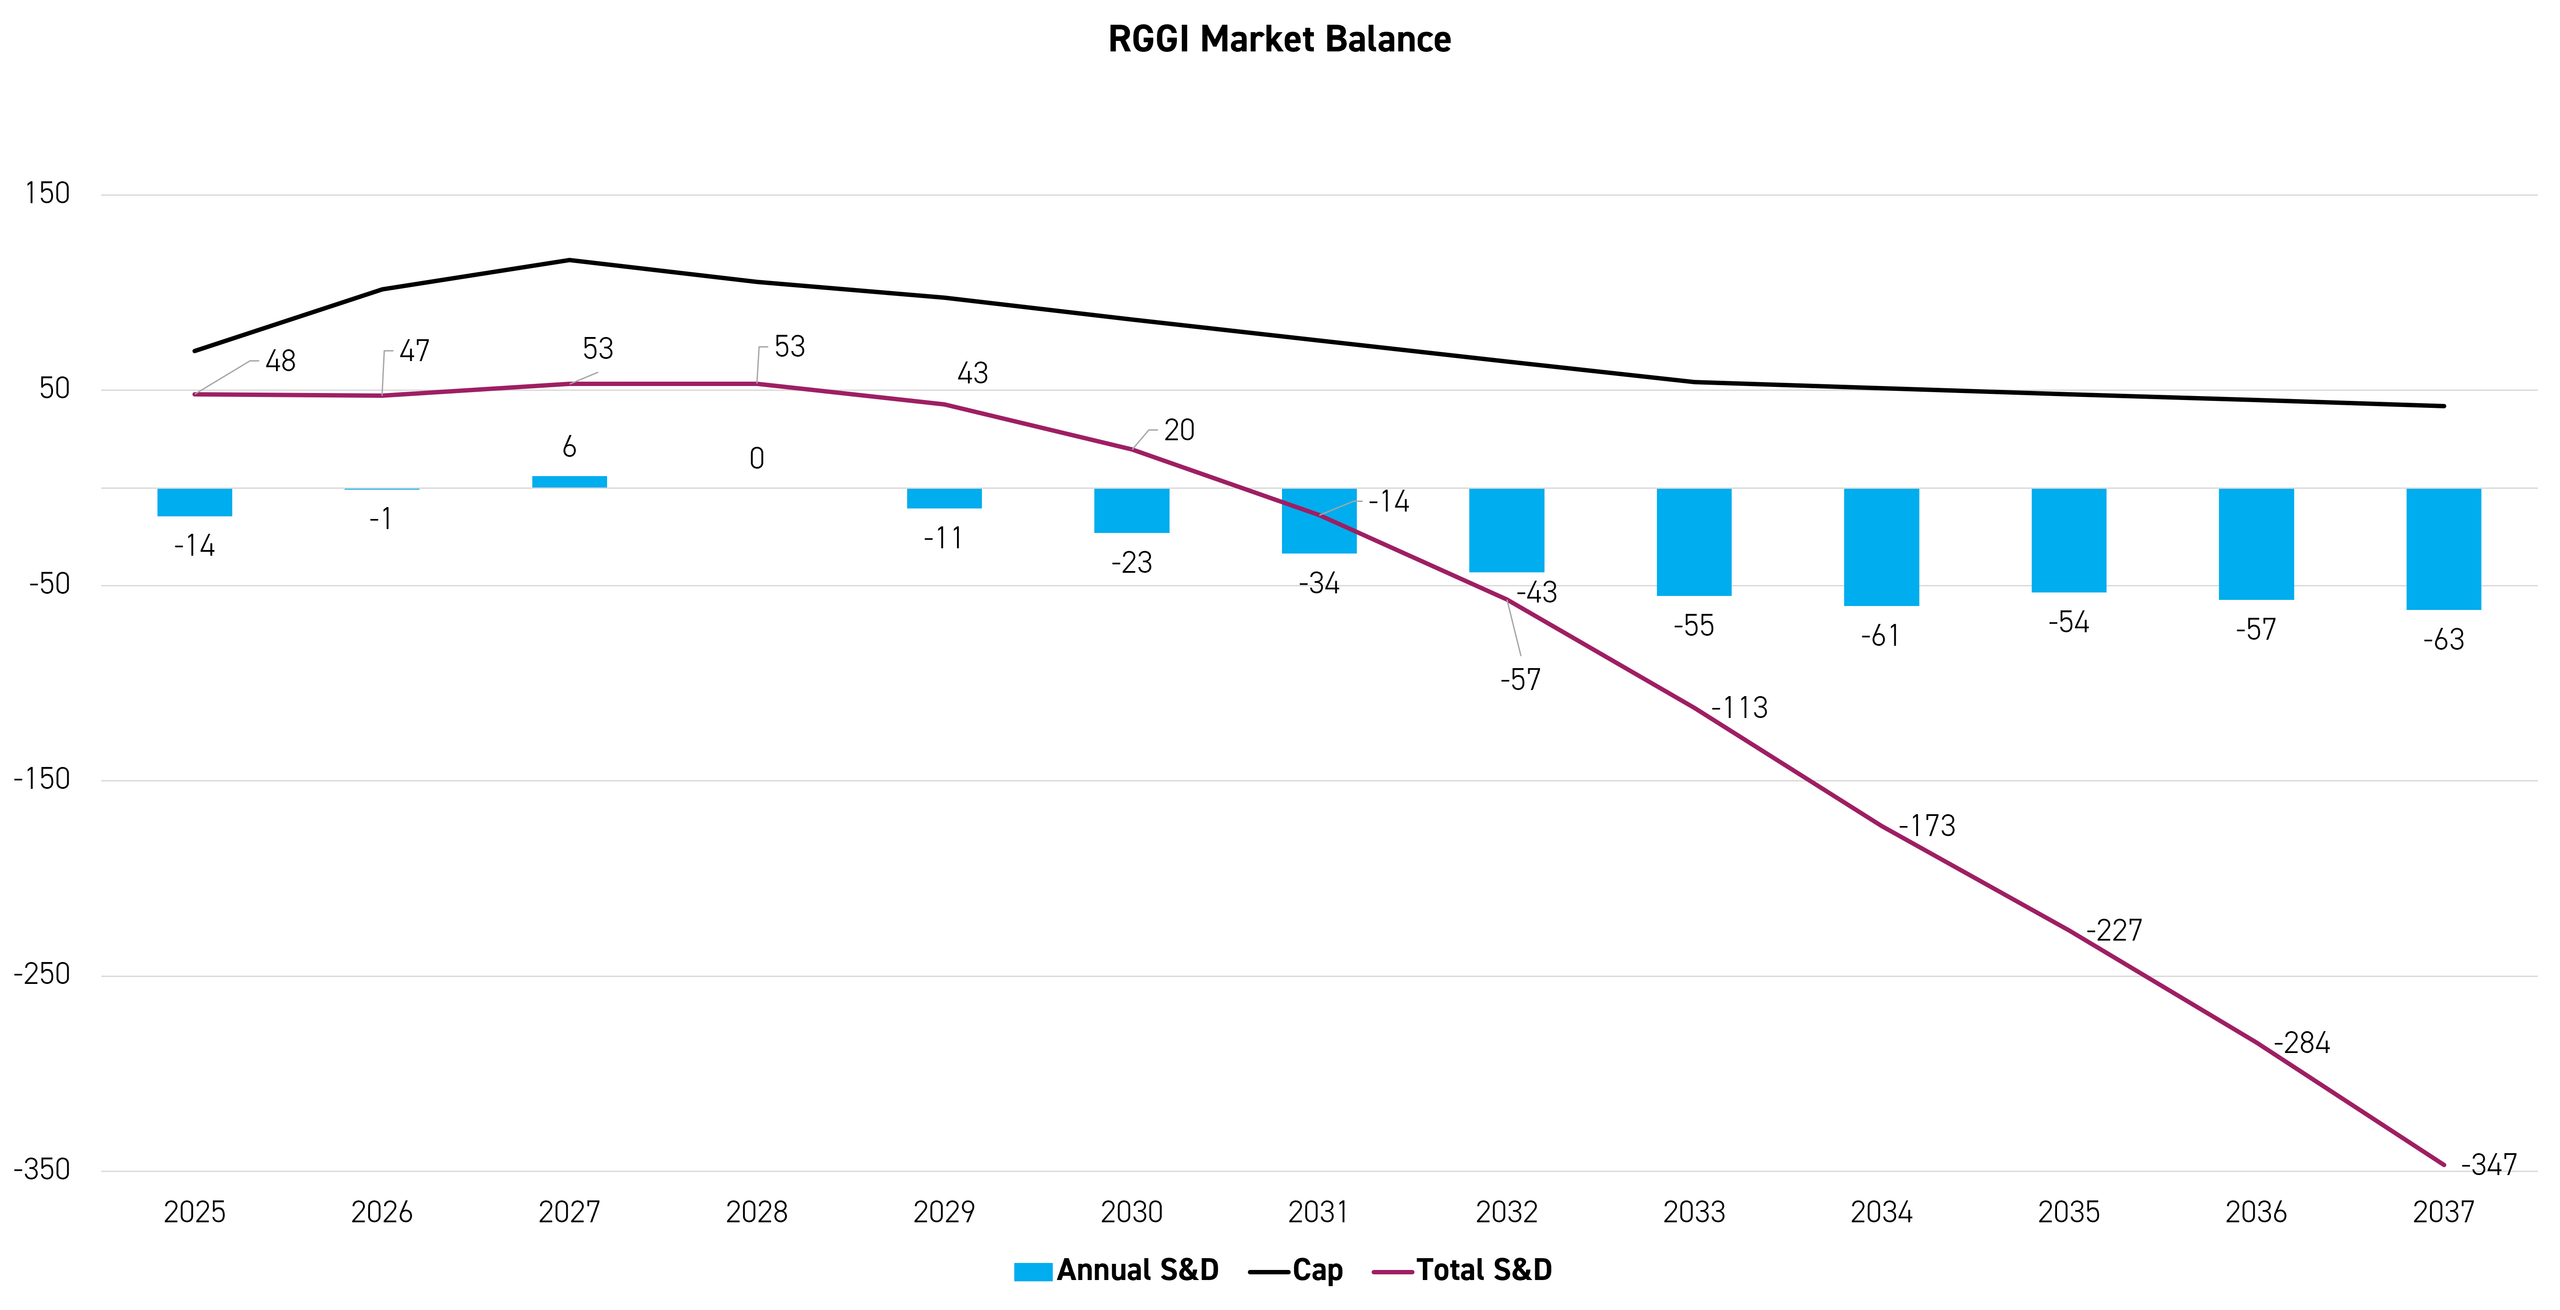
We updated our supply and demand balances for the Eastern US power market (RGGI) through 2030 in our October 29 blog. Figure 1 sets out our revised balances through 2037 based on projected supply under current legislation.
Figure 1: Updated base-case S/D balances for RGGI, 2025-37 (m short tons)
Source: CLIFI, Clear Blue Markets
As explained in our last blog, all 11 RGGI states have either now adopted or are in the process of adopting new cap trajectories through 2037 to take effect from January 1, 2027 so as to align with the outcome of the Third Program Review, and these new state trajectories will form the so-called Model Rule 2025 Cap for the 11 states collectively. Under the Model Rule 2025 trajectory, the cap falls by 11m short tons per year over 2027-33 (nearly four times the previous rate), and then by 3.1m short tons per year over 2034-37.
Given our long-term demand forecasts, this results in the accumulated bank of allowances becoming depleted by 2031, with the average annual deficit over the seven years 2031-37 hitting -52m short tons and the cumulative deficit over 2031-37 reaching -366m short tons. If we look at the entire forecast period over 2026-37, the average annual deficit over the 12 years is -33m short tons, and the cumulative deficit -395m short tons.
However, at the end of 2025 the cumulative bank stood at 48m short tons, so netting this from our projected cumulative deficit over our forecast period results in a cumulative deficit by the end of 2037 of -347m short tons. In reality, this scenario is unlikely, as such large annual deficits over 2031–37 and a substantial cumulative deficit would drive RGA prices to levels that would be difficult to sustain. We therefore expect the next RGGI Program Review, which is due to start in 2028, to introduce more supply over 2031-37, most likely via a third Cost Containment Reserve (CCR), which might sit above or even between the current two CCR tiers. The CCR tiers provide price stability support by serving as "speed bumps" that release additional allowances from a dedicated reserve if prices hit the tier levels at the auctions (i.e., Tier 1 is set at $19.50 and Tier 2 at $29.25 in 2027, each releasing roughly 15M allowances if triggered).
In the short term, though, with no further allowances being made available for the Q4 auction, both the Q4 auction and the secondary market should remain underpinned by robust compliance demand through year-end as covered entities look to cover their compliance shortfall. We therefore expect the market to remain around current levels or even trend slightly higher through the forthcoming compliance deadline in March 2027.
UKA discount to EUAs back to lows of the year with EU-UK Summit in focus
Figure 2 shows the spread between EU allowances (EUAs) and UK allowances (UKAs) since the beginning of the year, with UKAs having traded at a discount throughout, ranging from a low of €8.5/t in mid-January, to a high of €29.1/t in late March. On Friday, the spread closed at €8.9/t, close to the year’s low, on growing optimism that the EU-UK Summit to be held on November 20 in Brussels will see the formal announcement of the intention to link the UK Emissions Trading System (ETS) with the EU ETS.
Figure 2: UKA discount to EUAs (Dec-26 contract), January 1 - November 6, 2026 (€/t)*
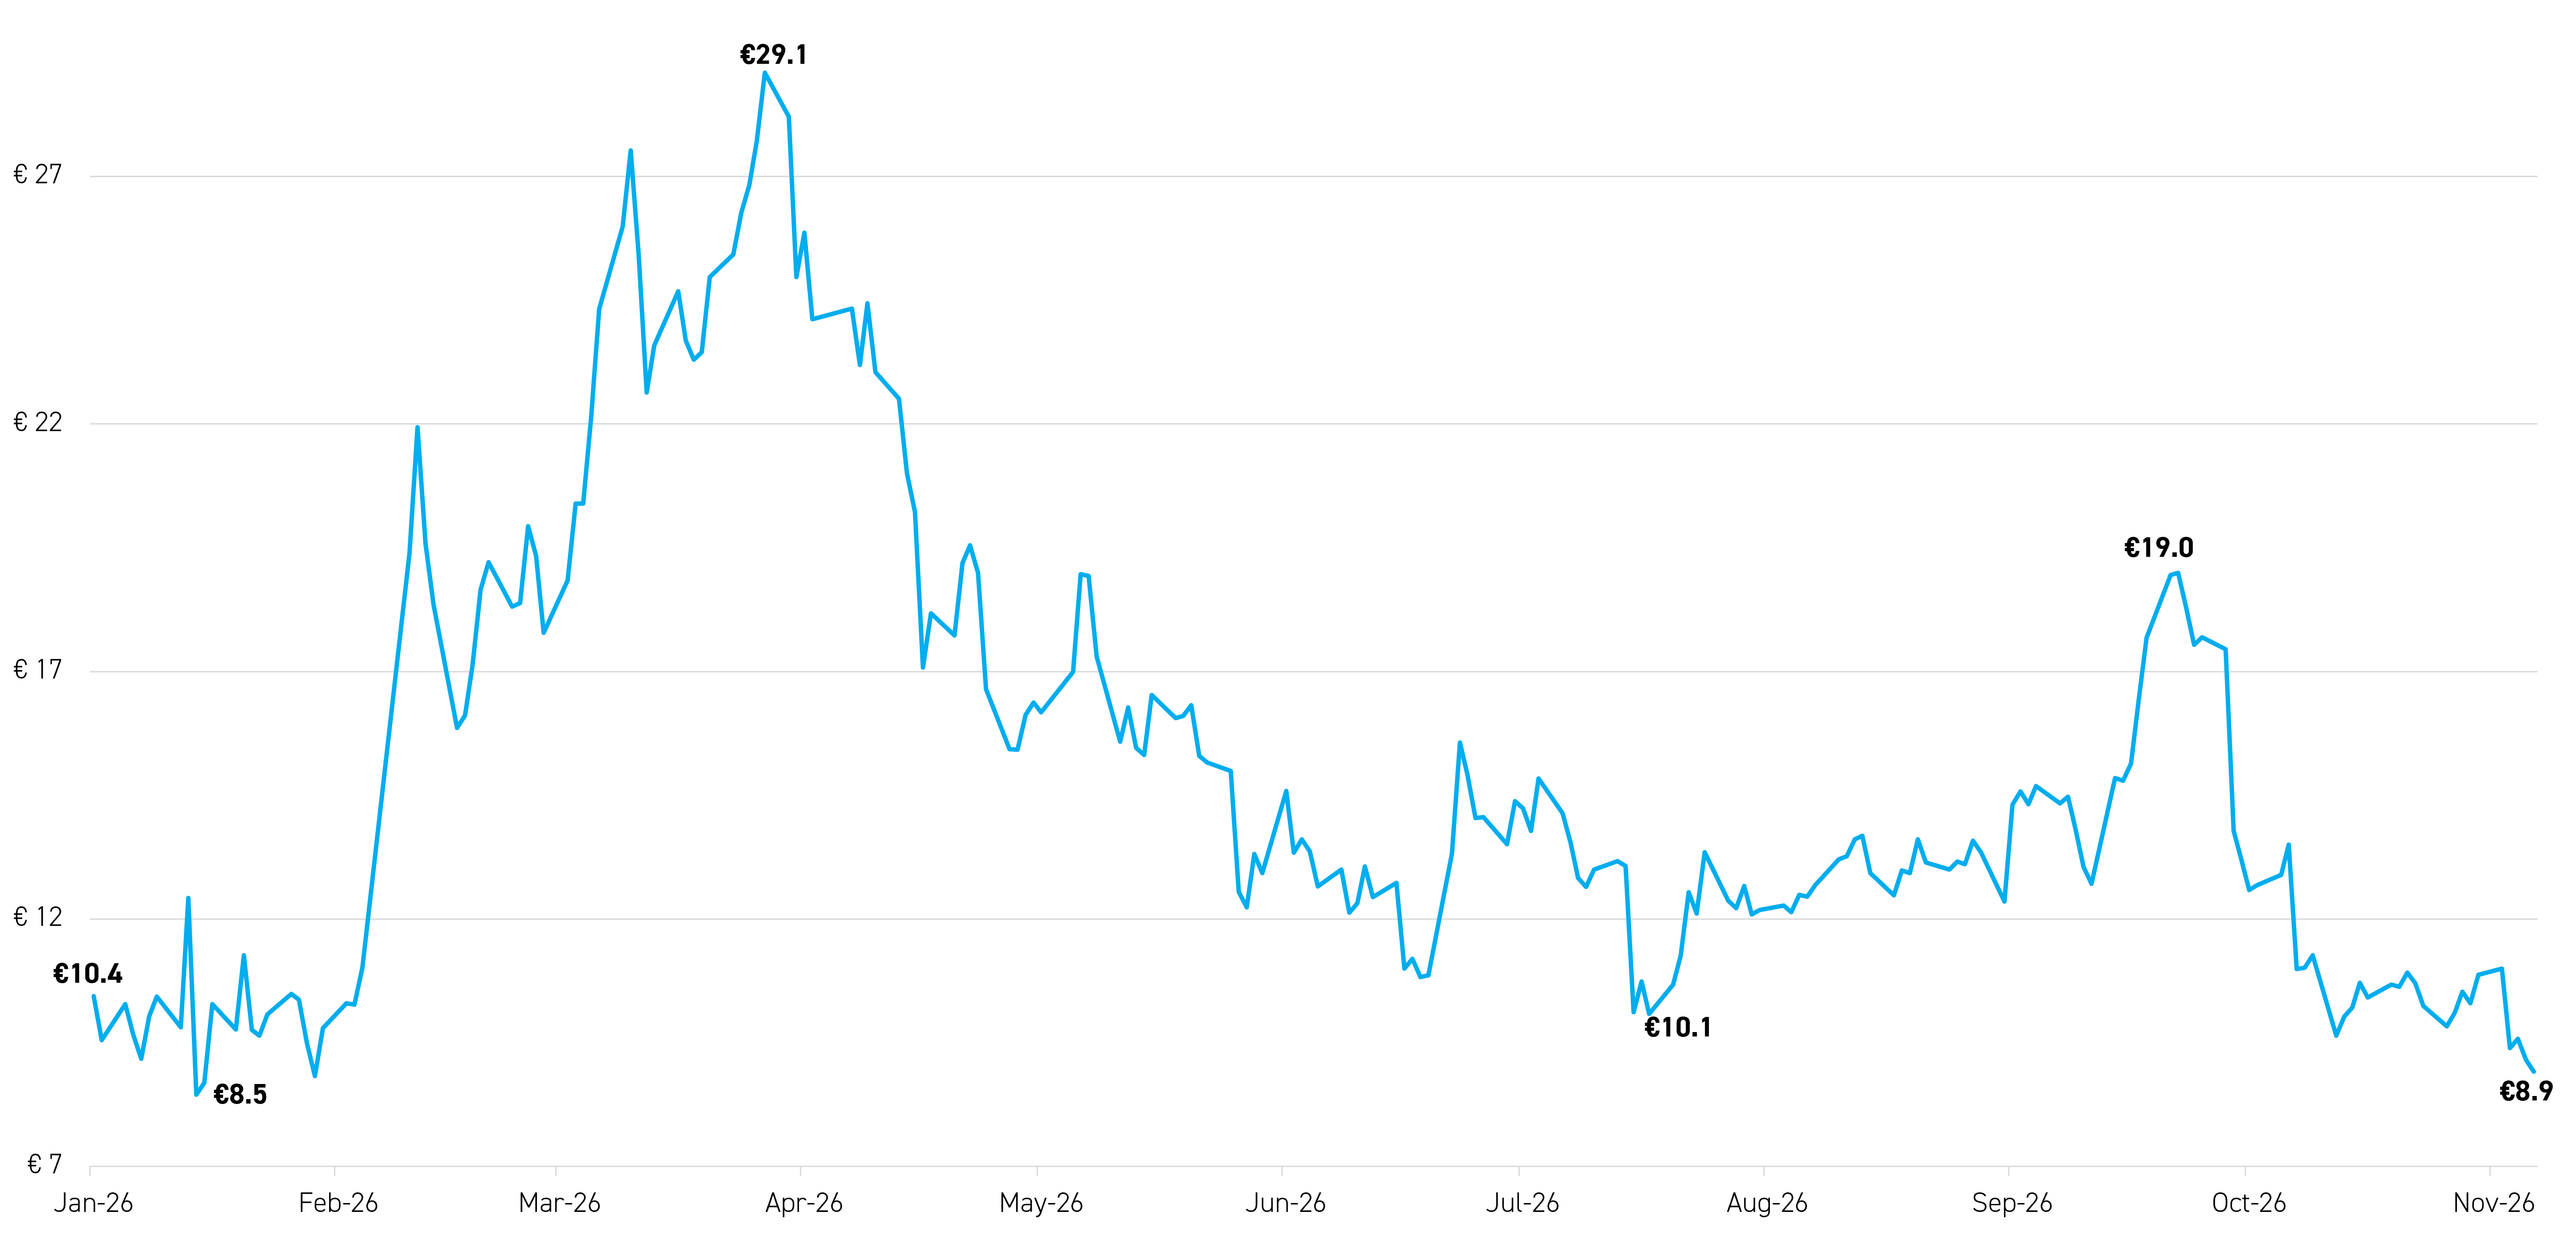
Source: Bloomberg. *Note that we have converted UKA prices into €/tonne here for ease of comparison.
This follows recent media reports to this effect, with a leaked draft communiqué for the summit already circulating. The Carbon Analytics firm ICIS has seen this draft communiqué and reported the following:
“We welcome the conclusions of the negotiations on linking the EU’s and UK Emissions Trading Systems (ETS agreement). This would allow mutual recognition of EU and UK allowances and exempt EU and UK goods from respective Carbon Border Adjustment Mechanisms subject to respective laws and procedures that we plan to launch without delays.”
And while it seems that there is at least one difficult issue to be resolved before the legal process on linking can be set in motion, we stick with the view that we have held throughout the year, namely that a formal deal on linking this year will result in full fungibility between UKAs and EUAs by April 2028.
Meanwhile, as far as EUAs are concerned, since our last blog where we highlighted our view that the €90/t level is a flashing red light for EUAs in the near term that could trigger negative political headlines and hence a correction in EUAs (as happened in February), prices have fallen back from their recent highs. The Dec-26 EUA contract settled at €86.55/t on Friday, down from their nine-month high of €90.52/t on November 2. We remain on the alert for price-sensitive political headlines in the run-up to Spain’s general election on November 29 and the EU Council meeting on December 17-18.
Carbon Markets Roundup
The S&P Global Carbon index was down 0.90% week over week. EUAs ended at €86.55, down 2.96% for the week, while UKAs slipped to £64.75, down 1.19%. In North America, CCA prices rose to $33.22, up 1.47% over the week, and RGGI allowances advanced to $43.81, gaining 6.33%. WCA also moved higher, finishing at $40.55, up 3.97% over the week.