Assessing the 2026 Outlook for EU, UK, and North American Carbon Markets
7 Min. Read Time
The S&P Global Carbon Credit Index saw a strong end to last year, posting an 10% return for Q4 and 22% for 2025 as a whole. The stand-out contributions were from the EU and UK markets (EUAs and UKAs), and Washington (WCAs). RGGI (Northeastern US power market) also performed well, but California (CCAs) was essentially flat in Q4 and down on the year as a whole. Heading into 2026, we see further upside in EUAs and UKAs, while also constructive on CCAs and WCAs, but neutral on RGAs.
EUAs rally hard in Q4 to cement strong 2025, stage now set for more gains in 2026
EUAs ended up 16% in 2025, and with the greenback depreciating 13% against the Euro over the year, the annual return in USD terms was 33%. Based on our analysis of the supply/demand dynamics in the EU-ETS over 2026-30, we have a constructive view on EUAs heading into 2026, as supply drops significantly faster than emissions through 2030. At the margin, we also expect a supportive behavioural impact from the introduction of the Carbon Border Adjustment Mechanism (CBAM) from January this year, as we think the industrial sectors covered by CBAM will likely increase their EUA hedging, and that EU importers of CBAM products will likely hedge some of their future liabilities via the interim purchase of EUAs. Overall, we think that in Q1-2026 the market will be targeting the all-time high (ATH) for the benchmark contract of €101.25 set in February 2023 (at that time the Dec-23 contract was the benchmark), and we expect EUAs to settle in a new trading range of €100-110/t in Q2 ahead of the regulatory reviews of the ETS and the Market Stability Reserve (MSR) in Q3-2026.
Ultimately, as the phase-out of free allowances gathers pace from 2028 onwards, we would expect prices to rise more sharply as the marginal cost of abatement in industry becomes the main driver of EUA pricing through the end of this decade. Given that the marginal cost of abatement in the Steel, Cement, and other industrial sectors – not to mention in the Aviation and Maritime sectors – is much higher than the cost of fuel-switching in the power sector, we think that in theory this implies prices of €150/t or higher in 2028 and beyond. In practice, however, we expect politics to become a bigger consideration for the EU-ETS as prices move structurally higher.
Accordingly, the main risk to our EUA price expectations is stronger political headwinds if prices break through the €100-10/t trading range we are projecting for Q2-2026, ahead of the EU-ETS review in Q3 and EU industrial demand therefore continues to languish. The record-high speculative positioning entering the new year – net speculative length hit an ATH of 118Mt for the week ending December 19 and remains close to this level as of the week ending January 2 – could also become a drag on prices at some point if and when some investors look to take profit at or above €100/t.
UKAs surge in 2025 on the EU-ETS linking trade, and we see more to come in 2026
UKAs ended up 76% in 2025, and after factoring in the greenback’s depreciation over the course of 2025, this represents a 92% return on UKAs in USD terms. This made UKAs the best-performing carbon instrument globally in 2025.
With the UK market itself also set to tighten over 2026-30 and with full operationalization of linking with the EU-ETS now a realistic prospect in late 2027/early 2028, we think the outlook for UKAs heading into 2026 is similarly strong as also expected with EUAs. In effect, the political momentum around linking now makes UKAs a discounted proxy for EUAs. In turn, this means that if our constructive thesis on EUAs is right, UKAs should benefit both from the continuing gravitational pull of higher EUA prices and a further narrowing of the discount between UKAs and EUAs.
The main risks would be if political momentum for linking with the EU-ETS were to stall, which looks unlikely as things stand at the moment, or if the EU-ETS itself were to face stronger political headwinds in 2026. In this latter respect, we would expect stronger political headwinds if EUA prices break through the €100-10/t trading range we are projecting for Q2-2026. The record-high speculative positioning in both UKAs and EUAs entering the new year could also become a drag on prices at some point if and when some investors look to take profit.
CCAs had a poor year in 2025, but the imminent ISOR publication makes us optimistic for 2026
CCAs ended down 15% in 2025, and as such was the worst-performing carbon instrument in the global carbon index over the course of the year. However, we see grounds for a more constructive outlook for CCAs in 2026.
The fundamental key to the CCA market in the near term remains the long-awaited Initial Statement of Reasons (ISOR), and we would expect CARB to publish it either later in January or in early February. Assuming the ISOR (the report outlining the reasoning and analysis behind the reform proposals) is indeed published within the next few weeks, the rulemaking should still be completed by September, thereby allowing the reduction in the cap through 2030 to take effect from January 2027. This would enable the market to focus on the bullish supply/demand fundamentals, and thus provide a constructive backdrop to price formation in 2026.
In terms of risks, with all the in-state regulatory and legislative uncertainties that have hung over the CA-ETS for the last two years now clarified, President Trump’s Executive Order (EO) from April last year remains the main threat looming over the market. Indeed, in this respect, there was a significant market reaction to a story reported by Carbon Pulse and other outlets on January 8-9.
As reported by Carbon Pulse,1 a consultancy called Alpha Inception emailed its clients on January 8, warning of imminent legal action by the Trump administration against state-level carbon markets (California, RGGI, and Washington), and as this seeped into the market in after-hours trading and through the trading day on 9 January, all of the US markets dropped.
CCAs had enjoyed a solid start to the year before this story came out, having risen 4.4% over the first five trading days of the year as of the market close on January 7. However, as traders digested the story after hours on January 8 and then through January 9, the market gave back all of its gains so far this year and a bit more, dropping 6% over the two days January 8-9 with the Dec-26 contract closing the week at $32.32/t, down 2% YTD.
Of course, legal action against California’s carbon market is nothing new, and we saw CCAs and other US carbon-market instruments sell off sharply last April when President Trump’s EO was first published, only to recover thereafter. Nonetheless, this latest story could now weigh on prices and cap any further upside in the near term until we know whether the Trump administration is indeed planning to bring forward concrete action against California and the other state carbon markets, and if so, what form such action takes and on what basis it rests.
Overall, however, we think any further selling pressure in the near term on the back of this story would be a long-term buying opportunity.
RGAs were up 7.5% in 2025, but we are neutral for 2026
RGAs closed 2025 up 7.5%, but notwithstanding the long-term supportive supply/demand dynamics, we see a more muted outlook for 2026. This is because after consecutive annual deficits in the last few years, we are forecasting modest surpluses both in 2026 and 2027 in line with increased supply versus 2025, before supply starts trending sharply down from 2028.
In terms of risks, and as with CCAs, President Trump’s EO remains the main threat looming in the background. Indeed, and as with CCAs, the story reported by Carbon Pulse and other outlets regarding the possibility of concrete legal action against state-level carbon markets at some point in Q1 led to a sharp sell-off in RGAs on January 8-9, with the Dec-26 contract closing the week at $24.99, down 8% versus the close on January 7, and down 4.8% YTD. We could experience volatility in RGA prices until the Trump administration announces any concrete action against RGGI.
WCAs were up 36% in 2025, and we remain constructive for 2026
The Front-Dec WCA contract settled on 31 December at $78/t, up 17% over Q4 and 36% over 2025 as a whole. As such, WCAs were the second-best performing carbon instrument in the global carbon index over the course of 2025 after UKAs.
We model the supply/demand dynamics of the Washington program on a standalone basis, and do not therefore assume any link with the CA-ETS/WCI program through 2030. We project supportive long-term dynamics for the WA-ETS supply/demand outlook, with a total drawdown in the number of allowances over 2026-30 of 34Mt. The Washington market is already in cumulative deficit – the only market of the five tracked by the index to be so – and our projections take the cumulative deficit in the WA-ETS at the end of 2030 to 38Mt versus 4Mt at the end of 2025. This severe tightness in the WA-ETS is precisely why the state is so keen to link with the CA-ETS/WCI.
For 2026, we project a further drawdown of 3Mt WCAs, and then after a modest surplus in 2027, the market tightens significantly over 2028-30. Again, our modeling here assumes no linking with California/WCI, but this underscores the urgency for Washington to link with a bigger market so as to reduce its standalone tightness.
In terms of risks, President Trump’s EO remains the main threat looming in the background. As with CCAs and RGAs, the story reported by Carbon Pulse and other outlets regarding the possibility of concrete legal action against state-level carbon markets at some point in Q1 led to a sell-off in WCAs on January 8-9, although less severe than for CCAs and RGAs. The Dec-26 contract closed on January 9 at $74.75, down $1 (1.3%) versus the close on January 7 before the story broke, $2 (2.6%) on the week, and $3.25 (4.2%) YTD. WCA prices could also see increased volatility until the Trump administration's decision is announced.
See the Carbon Pulse story here.
Carbon Market Roundup
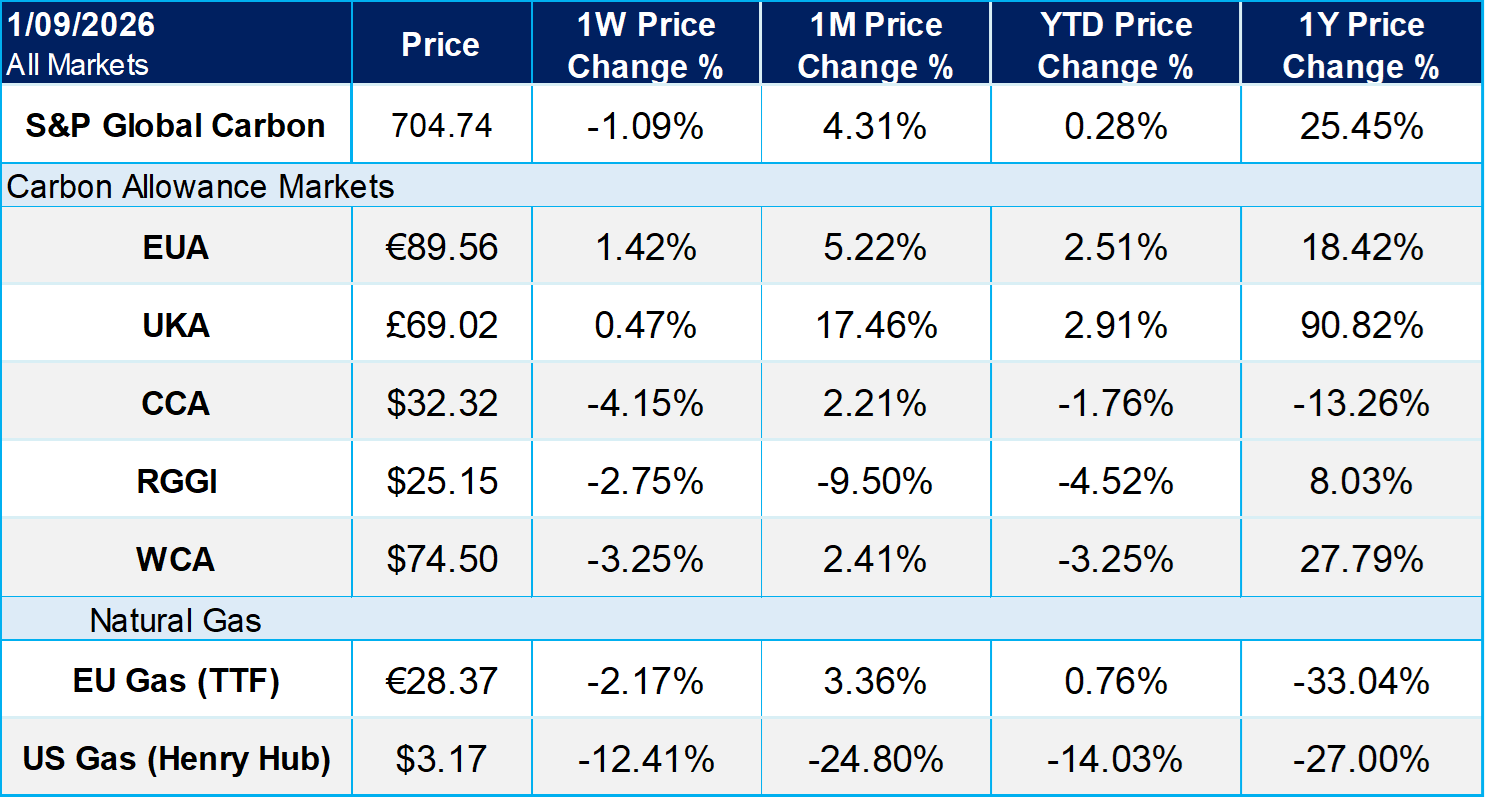
The weighted global price of carbon was $60.93, down 1.1% week-over-week. EUAs were up 1.4% for the week, ending at €89.56. UKAs were up a modest 0.5% at £69.02. CCAs fell 4.2% to close at $32.32. RGGI was down 2.8% at $25.15, and WCAs were down 3.3% at $74.50.