
ISOR Constructive for CCAs, Healthy Shakeout in EUAs and UKAs on Trump Tariff Threat
6 Min. Read Time
The California Air Resources Board (CARB) finally released its long-awaited cap-and-invest reform proposals, i.e., the Initial Statement of Reasons (ISOR) package, last week after a one-year delay, officially starting the rule-making process to tighten the cap trajectory starting in 2027. The response is largely positive, and simply having the ISOR package published is a strong step forward.
Meanwhile, after net speculative length in EUAs hit a new all-time-high (ATH) for the week ending January 9, President Trump’s new tariff threats on EU and UK imports over the weekend have prompted a healthy shakeout in EUA and UKA length: prices for both EUAs and UKAs have dropped 8% and 10%, respectively, so far this week in response to the shock announcement that the US will impose fresh tariffs on selected EU countries and the UK unless they support President Trump’s plans for the acquisition of Greenland. However, positioning in both markets had run up very aggressively over the last few weeks, and we think a correction here is healthy, and that the supply/demand fundamentals remain supportive long-term.
ISOR publication makes us constructive on CCAs for 2026
As we said in last week’s blog, the publication of the ISOR has been long-awaited by the market, and CARB finally released the ISOR on January 13 (once published in the Official State Register later this week, the formal rulemaking timetable begins). This reform is very significant, as it will enable the reduction in the cap to take effect from January 2027 through 2030. This means the market should now be able to focus on the supportive supply/demand fundamentals created by the new trajectory of the cap, thereby providing a constructive backdrop for price formation in 2026.
The ISOR package, specifically, provides the rationale and analysis for the market reform proposals, and we note three nuances worth noting:
- 118 million allowances removed from 2027-2030, plus 146 million AND 753 million removed post-2030.
- Offset accounting will also reduce supply by 6% with unused budget reintroduced.
- Introduced new ownership limits and triggers.
We think CARB’s ISOR implies a reduction in the cap very close to our own base-case modeling shown in Figure 1 below. Our modeling had already assumed that CARB would follow a ‘plain reading’ of AB-1207 (the California legislation extending the cap-and-invest program to 2045). Using this approach, we assume the 118Mt reduction in the cap through 2030 announced by CARB in October (which includes the 22Mt of allowance removals already mandated to account for offset use) and then assume further adjustments starting in 2028 for offset use in 2026 (since we will not know 2026 offset usage until November 2027). We then continue to adjust the cap based on the prior year’s offset use going forward.
Figure 1: Annual historical and projected supply/demand balances in the WCI, 2013-30 (Mt)
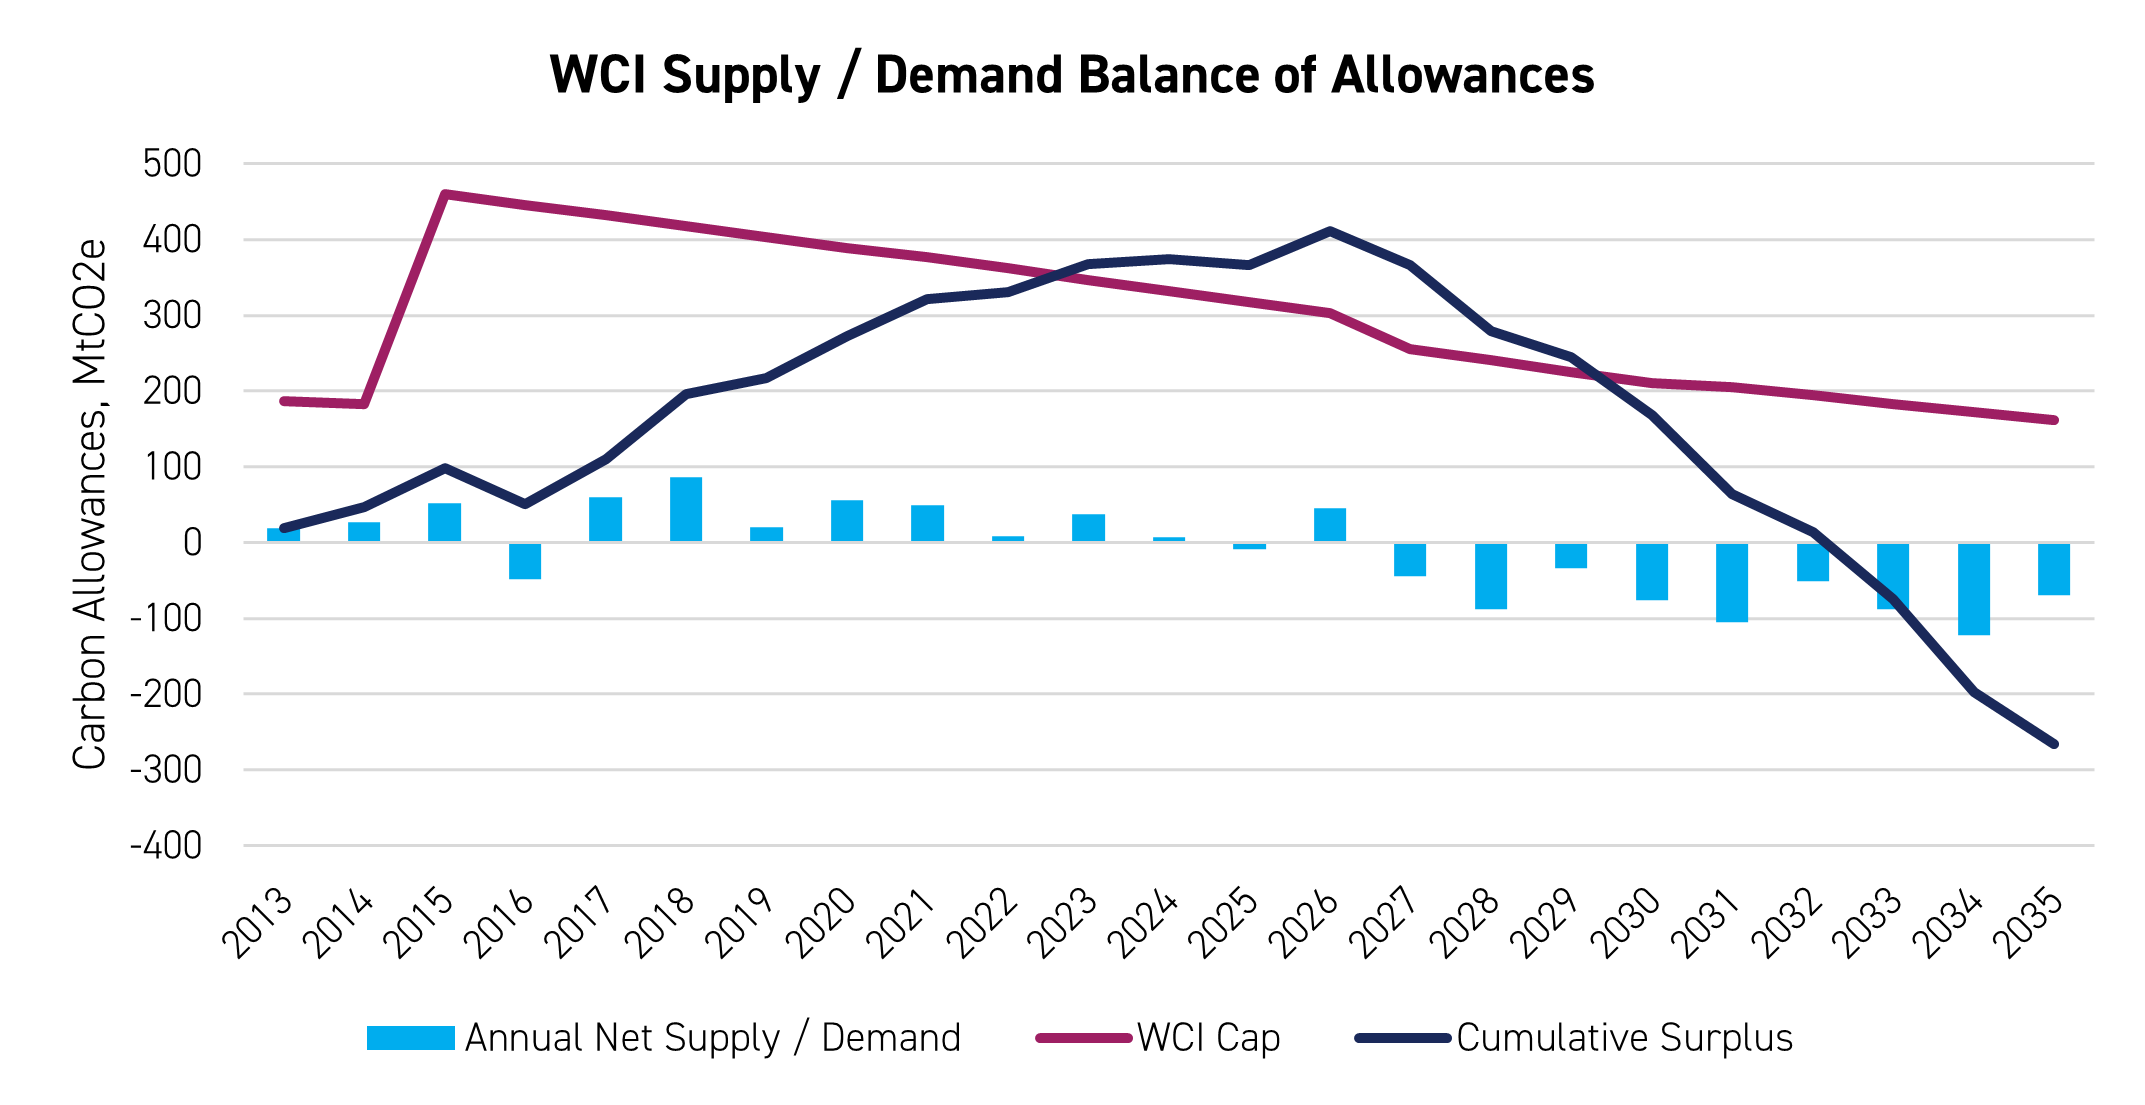
Source: Clear Blue Markets, CLIFI. California operates under the Western Climate Initiative (WCI), which administers the shared emissions trading market between California and Québec.
Under this approach, we project a further 37Mt of adjustments to the 2028-30 cap on top of the 118Mt CARB talked about at the October workshop. After then factoring in our demand forecasts, we project a total drawdown in the number of banked allowances over 2026-30 of 197Mt. On our numbers, this brings the remaining bank at the end of 2030 to 169Mt versus 366Mt at the end of 2025.
CCAs closed on Friday, January 16 at $31.78/t, down 1.5% in the week and 3.3% YTD. However, now that the ISOR is in the public domain with a supportive prognosis for the supply/demand dynamics through 2030 and beyond, we expect both compliance entities and investors to become more constructive on the outlook for prices in the coming weeks and months.
Meanwhile, another interesting development last week was CARB’s decision on January 14 to investigate the Alpha Inception note sent out to its clients on January 8,1 which raised the prospect of imminent aggressive legal action by the Trump Administration against the Californian carbon market, and which caused a drop in CCAs over January 9-10 (see last week’s blog for more on this). This should reassure market participants that CARB remains very confident in the legal foundations of the Cap-and-Invest program.
EUAs: Trump’s new tariff threat prompts healthy shakeout, long-term bull case still intact
EUAs ended last week at €92.04/t, up 3% on the week and 5% YTD. The most significant new information for the market last week was the release of the Commitment of Traders (COT) data, which showed another large increase in net speculative interest in EUAs of 10.6Mt. This increase brought the total net speculative length in EUAs as of January 9 to 125.7Mt, a new ATH, and the fifth new ATH since November 28 last year. Before this, the previous ATH was 104Mt back in April 2021, as shown in Figure 2.
Figure 2: Net Positioning of Investment Funds in EUAs, December 2019-January 2026 (Mt)
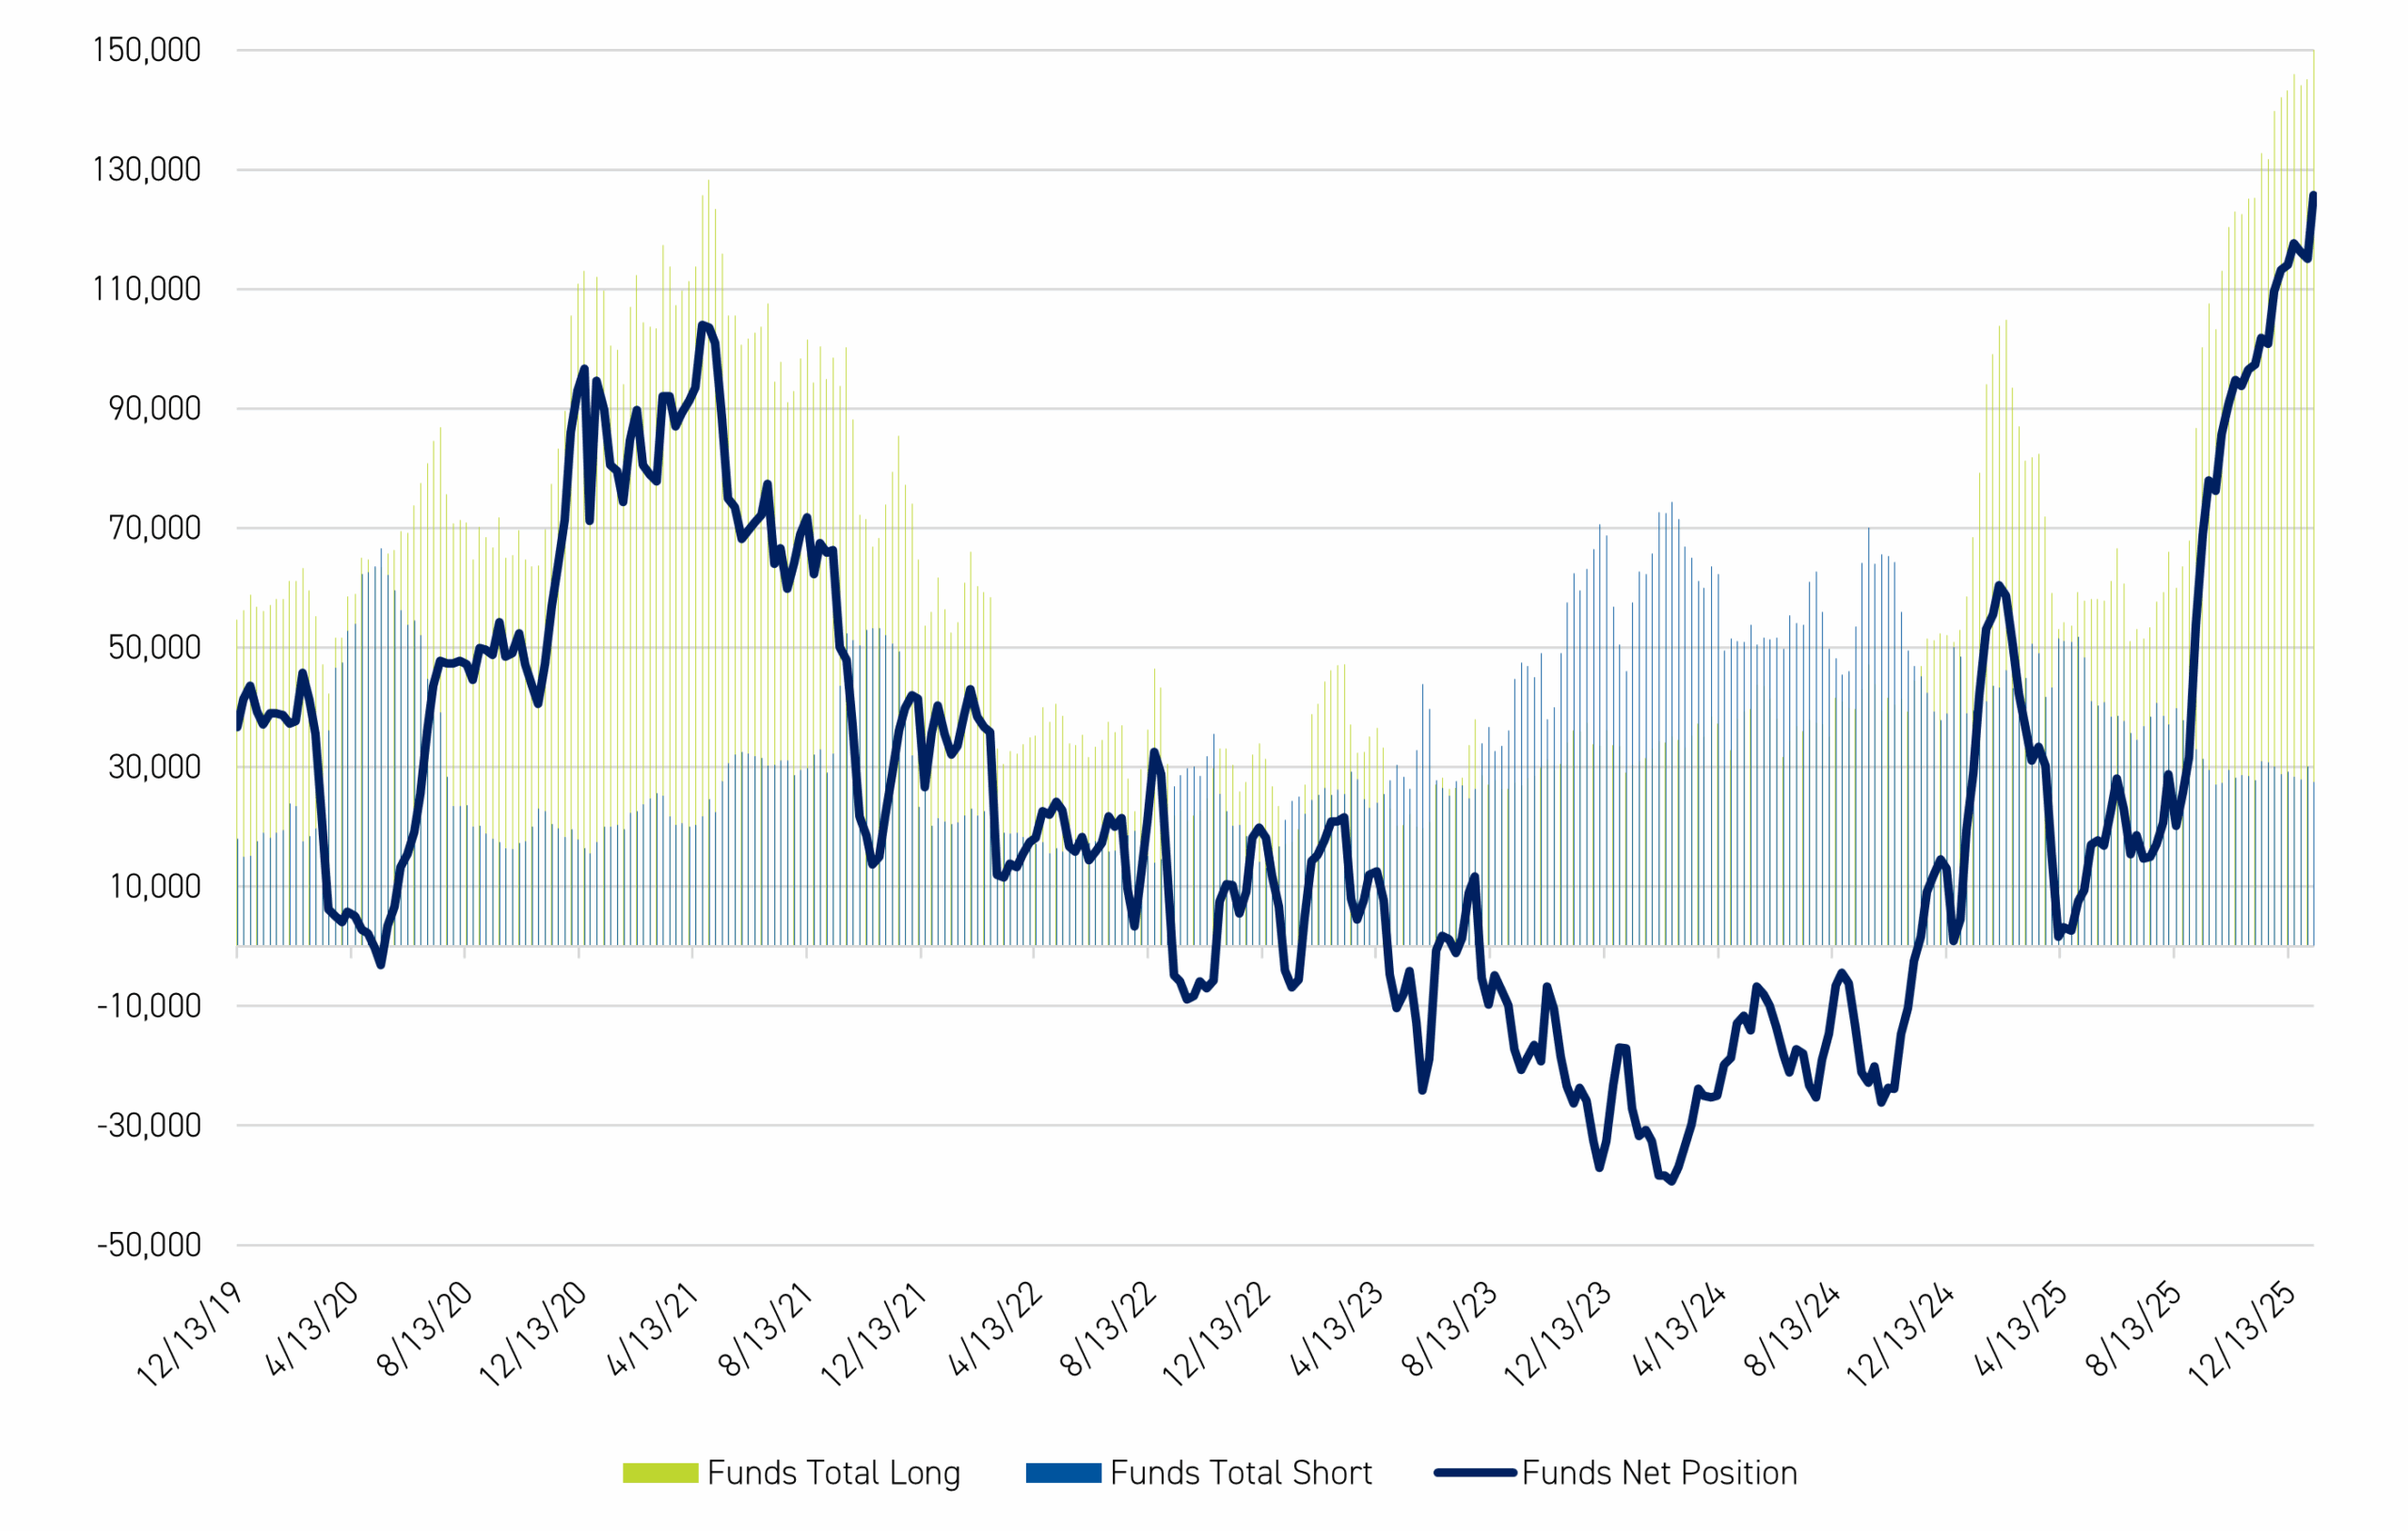
Source: ICE
The speed of the most recent build-up in net speculative length over the last five months is unprecedented. From mid-August to mid-January 2026 – that is, in only five months – investment funds increased their aggregate net-long position by 106Mt. Investment funds are clearly eyeing a step-change in market conditions heading into 2026 and betting on a potentially more aggressive hedging approach from the industrial and transportation (aviation and maritime) sectors, as the supply crunch starts to bite. However, while this build-up in net length fits with our own analysis of the supply/demand dynamics in the EU-ETS over 2026-30, it also makes the market vulnerable to sudden external shocks – and that is exactly what President Trump has now delivered.
Over the weekend, President Trump announced that he would introduce an immediate 10% tariff on selected EU countries – including the two largest EU economies, Germany and France – on February 1, rising to 25% as of June 1, if these countries do not agree to the sale of Greenland to the US by these dates.2 This has caused a sharp sell-off in EUAs over the last two days, with the benchmark Dec-26 contract closing on Tuesday, January 20 at €84.96/t, down 7.7% against last week’s close, and down 9.4% against last week’s YTD high of €93.8/t.
The price drop was triggered by a big shakeout in positioning, with heavy selling by speculators over the last two days. EUAs typically trade around 30Mt per day on the exchange, but on Monday, 66Mt traded, and yesterday, Tuesday, an ATH of 95Mt was recorded. Viewed from this perspective, the fact that EUAs did not drop further – and indeed that they bounced back from Tuesday’s low of €83.52/t at 2:30pm CET to end the day at €84.96/t despite continued high volumes in the afternoon – can be seen as a sign of the depth and liquidity of the market.
Overall, we think this correction is healthy in the context of such a massive recent accumulation of speculative length, and while the positioning shakeout may yet have further to run, and President Trump’s appearance in Davos may spark further market volatility depending on his messaging, we think the supply/demand fundamentals in the EU-ETS remain very supportive on a medium to long-term basis.
This conviction is supported by the fact that we see EUA supply dropping significantly faster than emissions through 2030. At the margin, we also expect constructive behavioural impact from the introduction of the Carbon Border Adjustment Mechanism (CBAM) from January this year, as we think the industrial sectors covered by CBAM will likely increase their EUA hedging, and that EU importers of CBAM products will likely hedge some of their future liabilities via the interim purchase of EUAs.
UKAs rallied last week on linking news but down with EUAs this week on Trump tariff threat
UKAs ended the week at £71.32/t, up 3.3%, having been up 6% on the previous week’s close at one point on January 14 after a Reuters article that day quoting EU Climate Commissioner, Wopke Hoekstra, reporting that the UK and EU would start formal negotiations around linking their respective carbon markets this coming week. This news has helped drive UKA prices up 6% YTD.
Figure 3: UKA discount to EUAs, Front-Dec contract, January 1, 2025-January 14, 2026 (€/tonne)
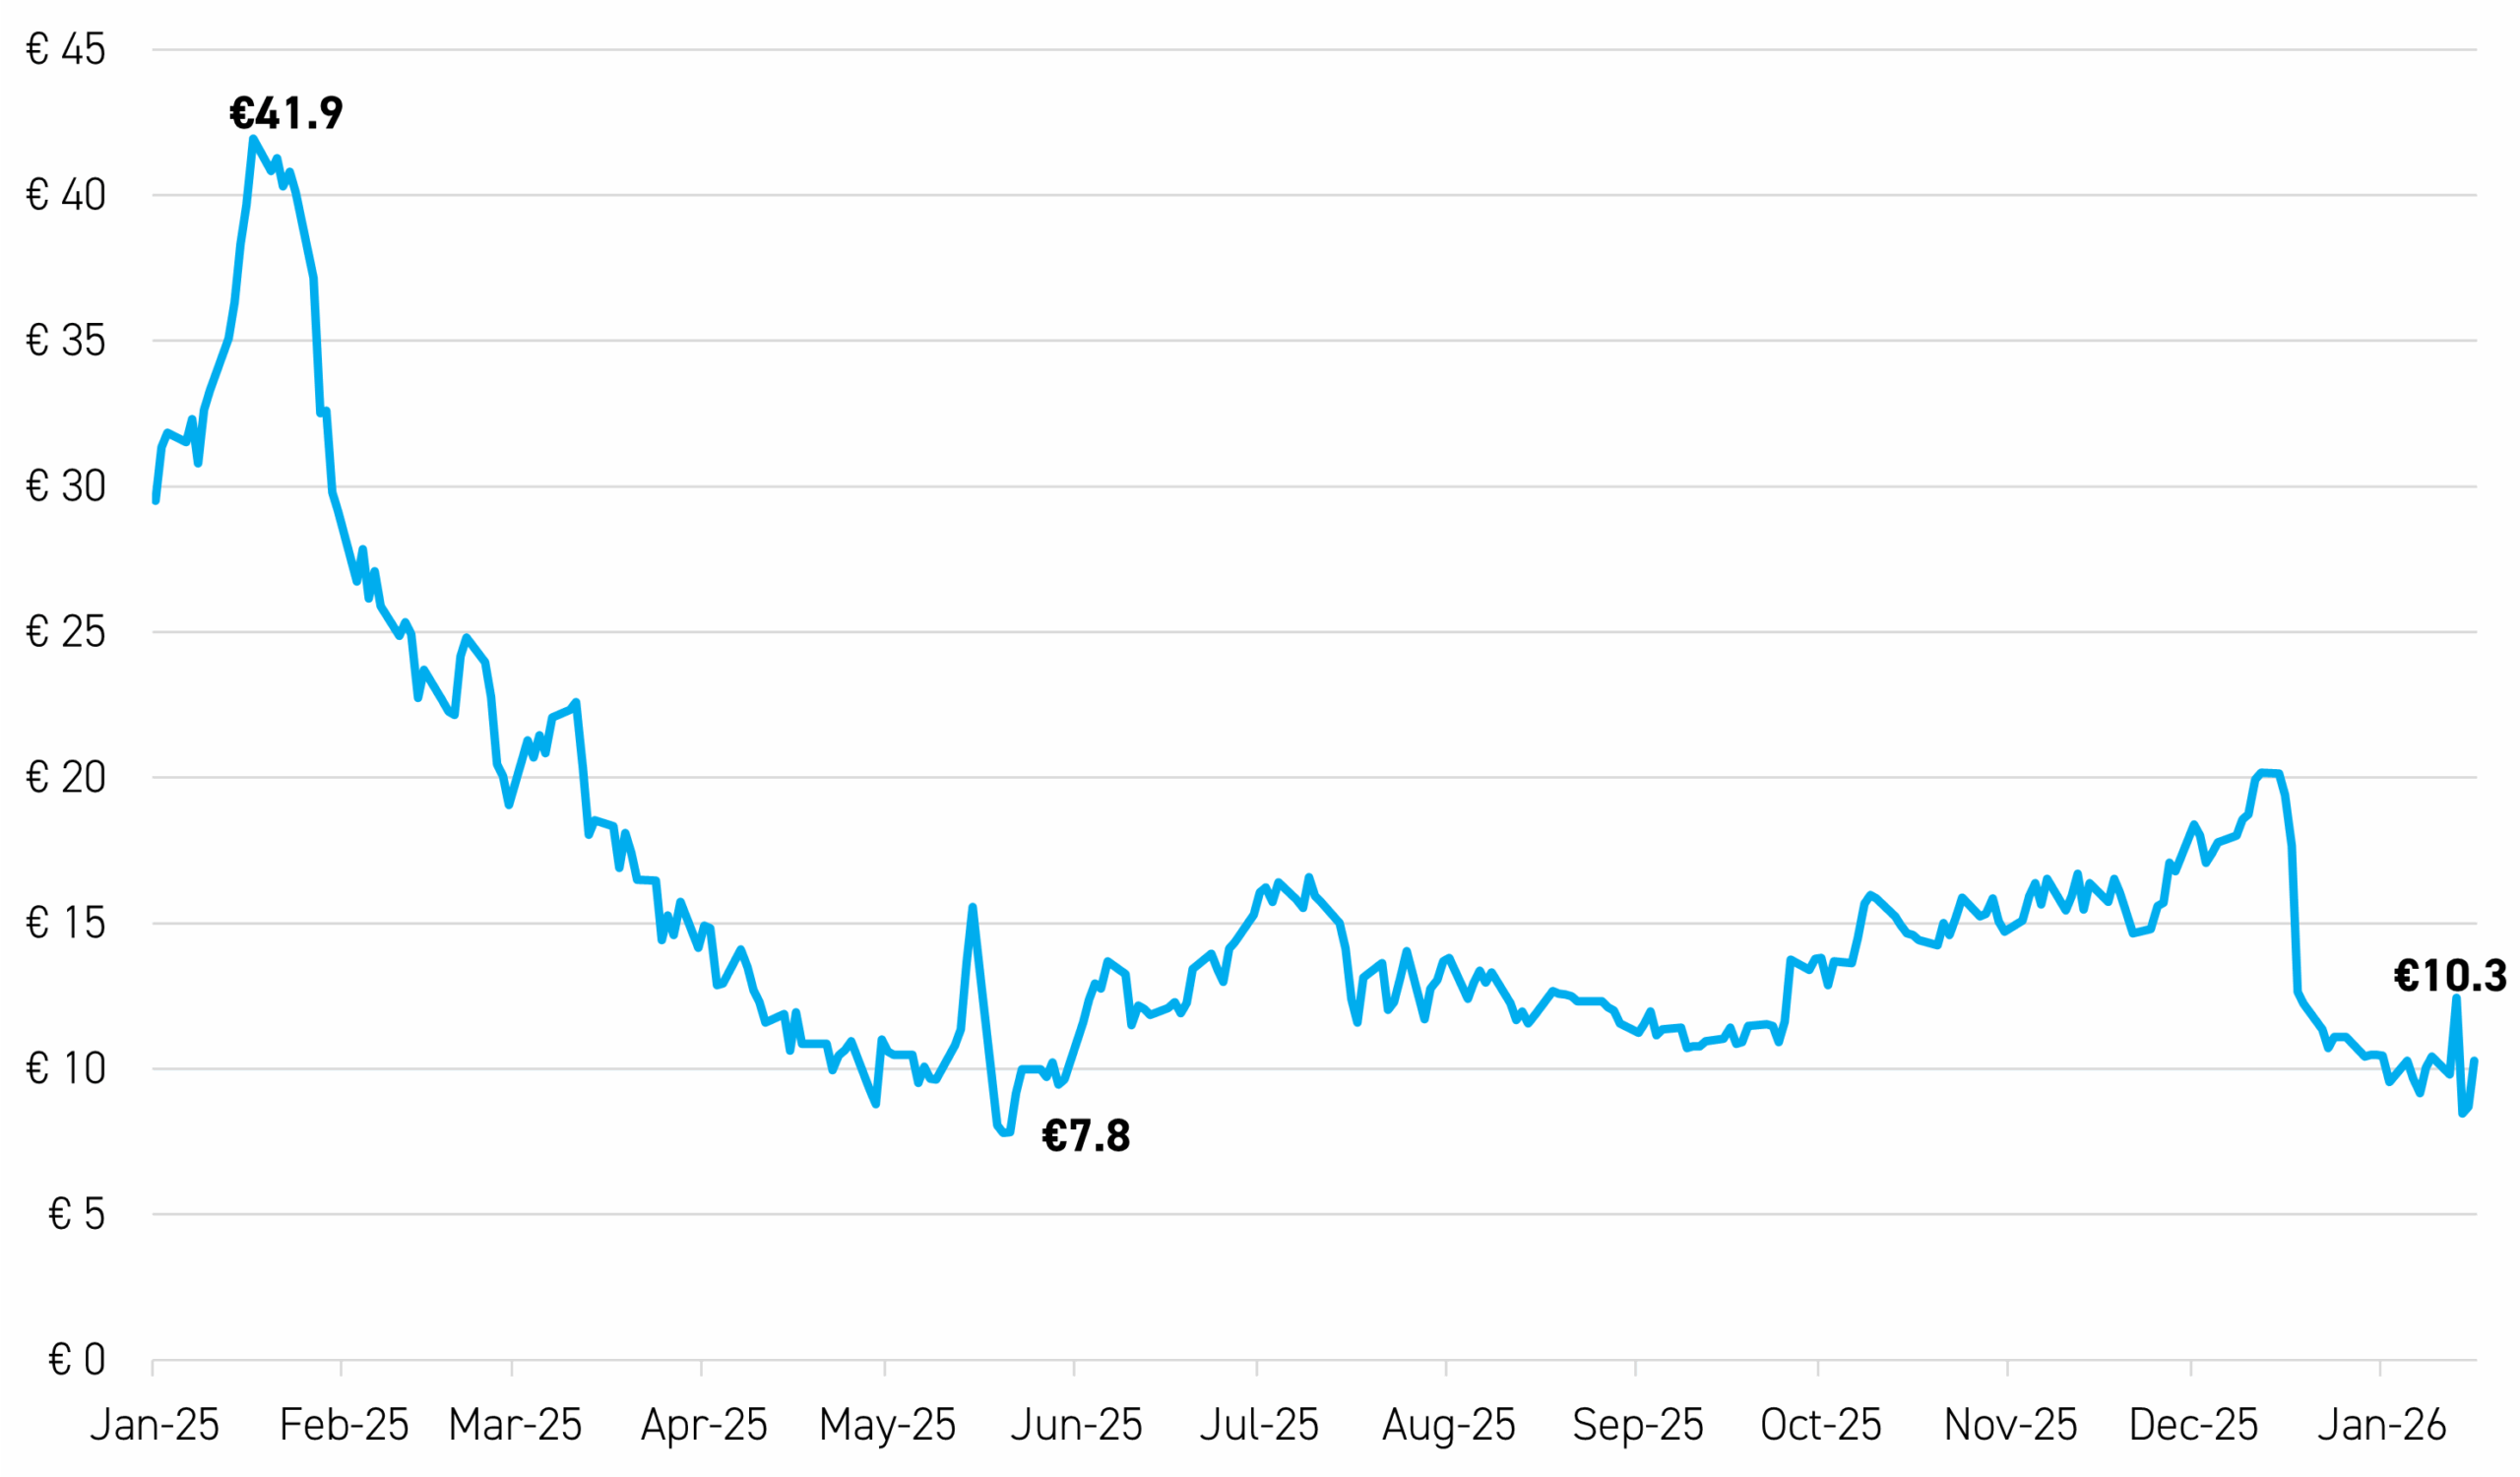
Source: ICE
As shown in Figure 3, the discount to EUAs has narrowed dramatically over the last 12 months, from €42/t at the beginning of 2025 to only €10/t as of market close last week. As we said in last week’s blog, the political momentum around linking now makes UKAs a discounted proxy for EUAs. In turn, this means that if our thesis on EUAs is right, UKAs should benefit both from the continuing gravitational pull of higher EUA prices and a further narrowing of the discount between UKAs and EUAs.
Similar to EUAs, President Trump’s threats of an immediate 10% tariff on UK exports to the US as of February 1, and 25% as of June 1 if the UK does not agree to the sale of Greenland to the US by these dates, have prompted a sell-off in UKAs so far this week.
The benchmark Dec-26 contract closed on Tuesday, January 20 at £64.03/t, down 10% against last week’s close of £71.35/t, and 15% from last week’s YTD high of £75.45/t. The cause of the correction mirrors that of EUAs, with net speculative length hovering near its ATH as of January 9, and UKAs are therefore vulnerable to a correction in the face of any sudden external shock.
Nonetheless, we see this correction as healthy and continue to view the medium- to long-term fundamentals as very constructive.
Carbon Market Roundup
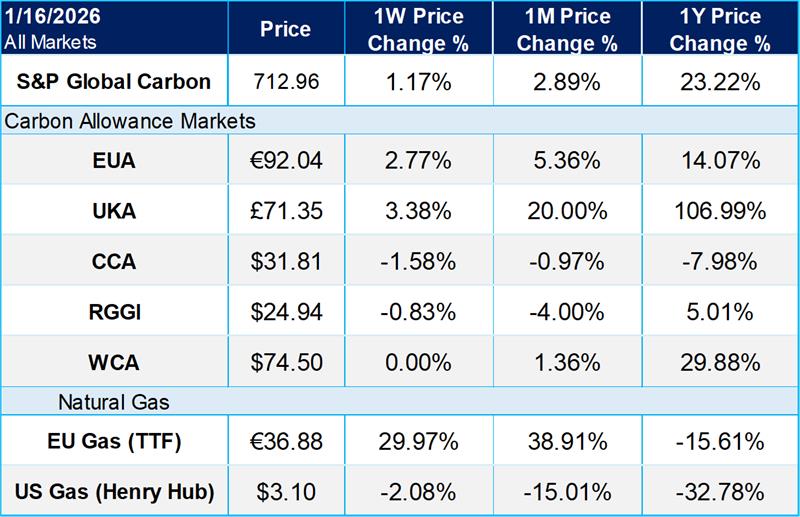
The weighted global price of carbon was $61.64, up 1.17% week over week. EUAs rose 2.77%, closing at €92.04. UKAs gained 3.38%, finishing at £71.35. CCAs slipped 1.58% to close at $31.81. RGGI allowances were down 0.83%, at $24.94. Washington was unchanged, at $74.50.
- See CARB’s Market Notice of 14 January here.
- See the Financial Times story of 17 January, Trump to hit EU with 10% tariffs until Greenland deal is reached